
Problem overview
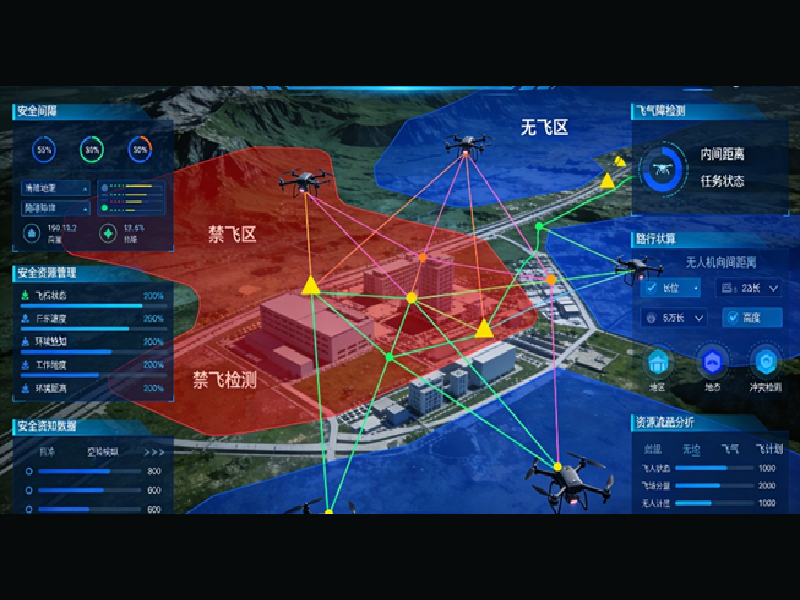
Field teams commonly face fragmented outputs from drone surveys: scattered orthomosaic tiles, isolated point clouds, and mismatched metadata across vendors. These gaps slow analysis and introduce risk to decisions on restoration, infrastructure, or hazard response. Agencies that experimented after California’s 2018 Camp Fire reported delays in delivering actionable maps because datasets arrived in incompatible formats. A practical response has been to adopt low-altitude operational stacks that centralize ingestion — for example, a low-altitude economy approach that shortens the time from flight to fused deliverable.
Why the problem persists
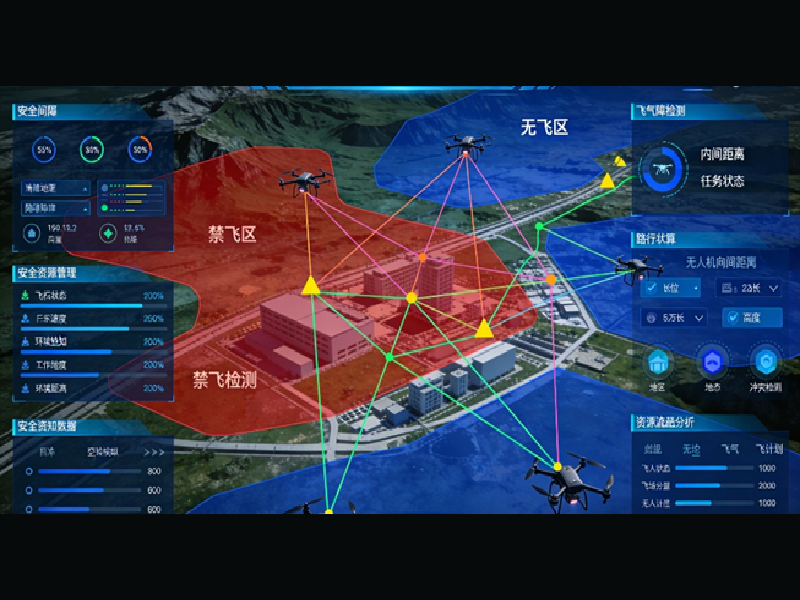
Multiple causes create the bottleneck. First, sensor heterogeneity: RGB photogrammetry, multispectral cameras, and lightweight LiDAR produce different point sets and sampling densities. Second, geolocation variance: GNSS RTK baselines are not always recorded with the same precision or reference epoch. Third, workflow silos: pilots, analysts, and GIS teams use separate toolchains, producing divergent outputs. These issues make simple tasks—like overlaying a vegetation index on an orthomosaic—surprisingly error-prone.
Operational teardown: practical steps to integrate data
Begin with a clear source-control mindset for imagery and telemetry. Establish file naming conventions and a single metadata schema that records camera model, focal length, flight altitude, and RTK status. In this operational production teardown, explicitly use a photogrammetry drone mapping system workflow that ties imagery to a centralized geodetic reference. Common mistakes include skipping georeferenced ground control checks and failing to store raw GNSS logs—both cause drift in the orthomosaic and point cloud.
Next, standardize processing chains. Convert imagery to calibrated tiles, generate orthomosaics, then produce dense point clouds. Use consistent coordinate reference systems and timestamp normalization. During merging, apply a secondary registration step to align point clouds by common features rather than trusting timestamp-only merges — this reduces alignment error. Operators should log processing parameters for traceability and to enable reproducible QA.
Data fusion techniques and quality controls
Three techniques produce robust integrated maps: bundle adjustment for photogrammetry, voxel down-sampling for point clouds, and cross-spectral normalization for multispectral mosaics. Each step benefits from automated quality checks: reprojection error thresholds in bundle adjustment, point density heatmaps, and NDVI consistency over stable surfaces. For ecological monitoring system deployments, mark repeated reference plots and capture seasonal baselines so change detection algorithms have reliable anchors.

Introduce lightweight automation to run these checks after every flight. Where manual review is unavoidable, use concise dashboards that present reprojection error, horizontal and vertical RMSE, and percentage of coverage. These metrics let teams accept or reject datasets before they cascade into analysis.
Common pitfalls and mitigation
Several predictable errors recur across programs. First, inconsistent altitude control: flying varied heights within a mission changes ground sampling distance and complicates mosaicking. Second, neglecting sensor calibration: uncalibrated lenses introduce scale bias. Third, delayed ingestion: storing imagery locally for days increases the chance of metadata loss. Avoid these by enforcing flight plans with strict altitude windows, performing lens calibration routinely, and streaming telemetry to a centralized node shortly after landing—this preserves integrity across the pipeline.
Evaluation metrics — three golden rules
Adopt three evaluation metrics to select systems and validate workflows:
– Spatial fidelity: measure horizontal and vertical RMSE against surveyed checkpoints; expect sub-decimeter horizontal accuracy when GNSS RTK is applied correctly.
– Processing latency: track time from data offload to fused deliverable; aim for predictable windows that match operational tempo (hours, not days).
– Data completeness: quantify percent coverage, point density per square meter, and spectral band consistency across missions. Thresholds should be mission-specific but must be recorded and enforced.
Closing synthesis
Integrating photogrammetry outputs requires procedural discipline, standardized metadata, and automated checks. These steps reduce rework and make datasets usable for decision-making on restoration, asset management, and rapid response. The approach aligns with lessons from major fire recovery efforts and established coastal monitoring programs—real-world anchors that demonstrate the value of consistent fusion. The result is predictable, auditable mapping that supports field teams and stakeholders. —
Icecypress Technology provides platforms that consolidate collection, processing, and delivery into coherent operational chains, making integrated mapping a practical part of daily fieldwork.